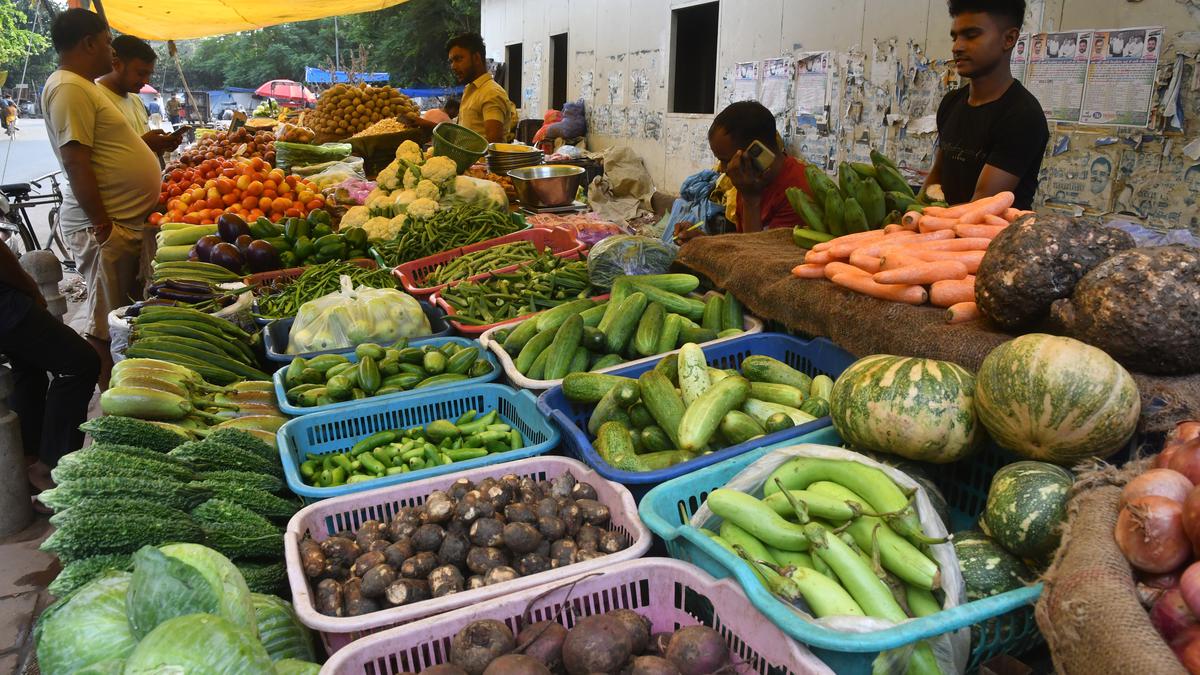
Inflation drivers: Buyer seen buying vegetable, as the In a relief to consumers, the retail inflation in India eased in the month of August on the back of cooling vegetable and food prices
| Photo Credit: SUSHIL KUMAR VERMA
Typically, inflation in India is primarily influenced by factors related to supply but there are times when demand factors also play a significant role, according to an article published by the Reserve Bank of India as a part of their December bulletin. During the two waves of COVID-19, supply disruptions were the main cause of inflation. However, following the Russia-Ukraine conflict, the driving forces shifted predominantly to factors related to demand, the article concludes.
It argues that at the start of the pandemic, lockdowns caused a major decline in production and demand, leading to a steep drop in economic growth. This phase also saw a decrease in commodity prices due to weakened demand. However, as the economy began to reopen with distribution of vaccines and release of pent-up demand, demand recovered more rapidly than supply. This imbalance resulted in rising pressures on commodity prices. The onset of the Russia-Ukraine conflict in 2022 further intensified supply chain challenges and added to commodity price pressures.
Using the Centre for Monitoring Indian Economy’s consumer expenditure data, the article tries to find out whether inflation in India is due to factors on the supply side or demand side. When there is an unforeseen shift in both prices and quantities within a month that aligns in the same direction, this approach categorises the inflation for that month as being driven by demand. This means that an increase in demand leads to a rise in both prices and quantities, while a decrease in demand results in a reduction in both. Conversely, inflation is considered to be supply-driven if there is an unexpected change in prices and quantities that move in opposite directions. In this case, a decrease in supply is linked with a lower volume but an increase in price, and vice versa.
Using the above methodology, analysis of data from January 2019 to May 2023 suggests that categories such as vegetables, oils and fats, milk, eggs, pulses, and sugar frequently experience supply-side constraints. In contrast, items like non-alcoholic beverages, personal care products, and health-related goods are mainly affected by demand-side factors, as illustrated in Chart 1 .
Chart 1 | The chart shows the percentage contribution of demand and supply factors to Consumer Price Index (CPI) sub-groups level inflation in the given period.
Charts appear incomplete? Click to remove AMP mode
In the next step, demand and supply factors at the sub-group level were combined using the CPI weights to assess overall headline inflation. The analysis reveals that inflation was mainly driven by supply factors during October 2019-January 2020 (due to excess rainfall causing supply disruptions), throughout the various stages of the pandemic (restrictions and supply chain issues) and at the beginning of the Russia-Ukraine conflict (supply shortages and spikes in global commodity prices). On average, supply-side factors accounted for about 55% of the CPI headline inflation from January 2019 to May 2023.
Chart 2 | The chart shows the contribution of demand and supply to CPI Inflation excluding housing, each month, between January 2019 and May 2023.
In contrast, the impact of demand-side factors on headline inflation decreased during the COVID-19 crisis, dropping to 27.1% in 2020 from 41.5% in 2019. However, the significance of demand-side factors in driving inflation saw intermittent increases post the COVID-19 waves when restrictions eased and after the Russia-Ukraine conflict started, notably contributing to the peak in headline inflation in April 2022. Over the entire period from January 2019 to May 2023, the contribution of demand drivers to inflation stood at 31%.
Source: RBI article titled, ‘Recent Inflation Dynamics in India: Role of Supply vis-à-vis Demand’
Also read: Data | Cost of preparing meals at home rose by 65% in five years, wages by just 28%-37%
Watch our Data video: Food prices are on the rise, but are our earnings keeping up? | Data Point video