In 2023, India surpassed China to become the world’s most populous country. The development came against the backdrop of a declining birth rate (6.4 births per 1,000 people) and total fertility rate (~1%) in China. China also recorded a negative population growth rate for the first time in six decades. This means a rising dependency ratio, which is projected to increase over time. In contrast, India’s population, despite reaching replacement levels (total fertility rate of 2.1), is expected to grow and peak around 2060.
These developments have significant consequences on domestic consumption in the two countries. Consequently, it becomes imperative to compare their consumption figures and strengths/weaknesses. A cross-comparison also assumes significance owing to the contrasting experiences of the two countries in their respective geopolitical landscapes.
How do the numbers compare?
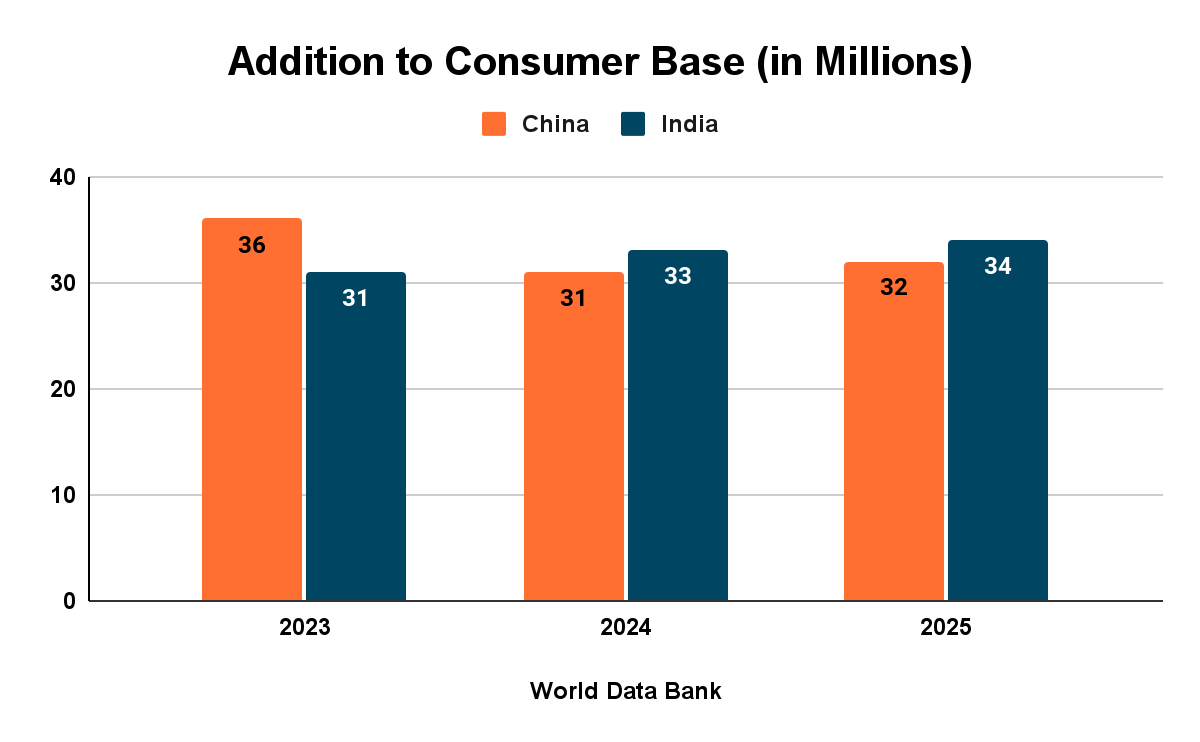
Both India and China have a large consumer base. A consumer is anyone who spends more than $12 a day, as per the Purchasing Power Parity [PPP], 2017.

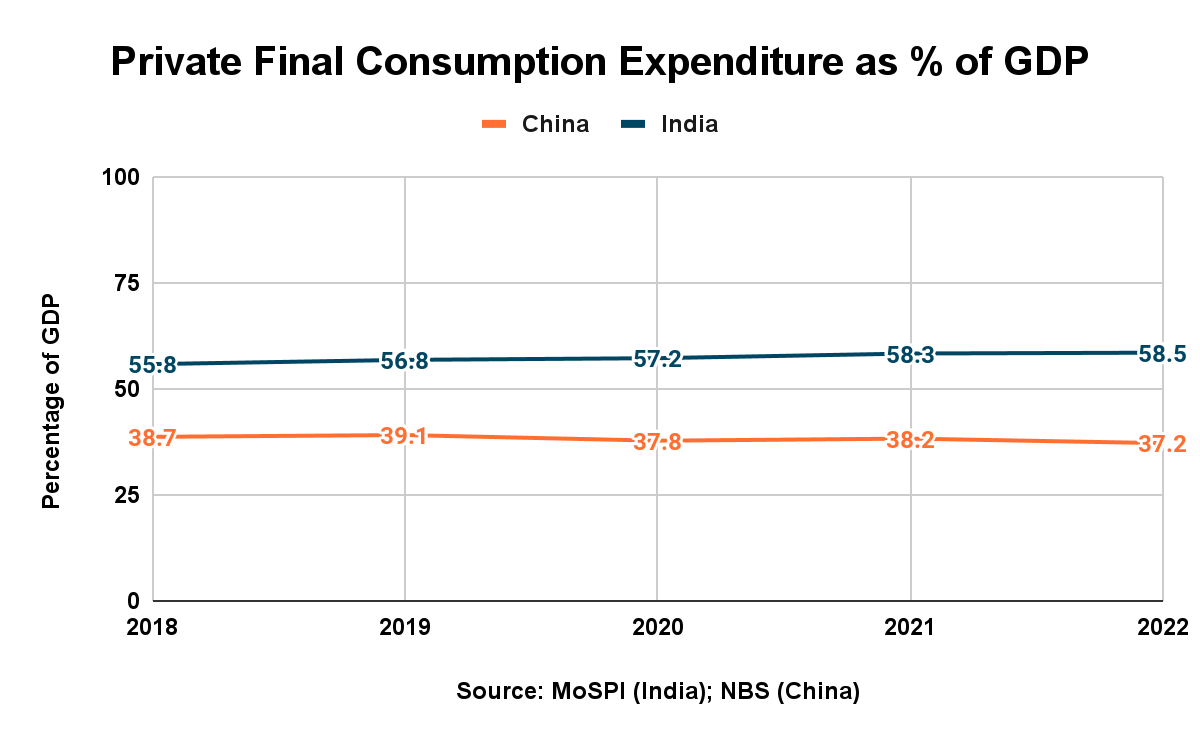
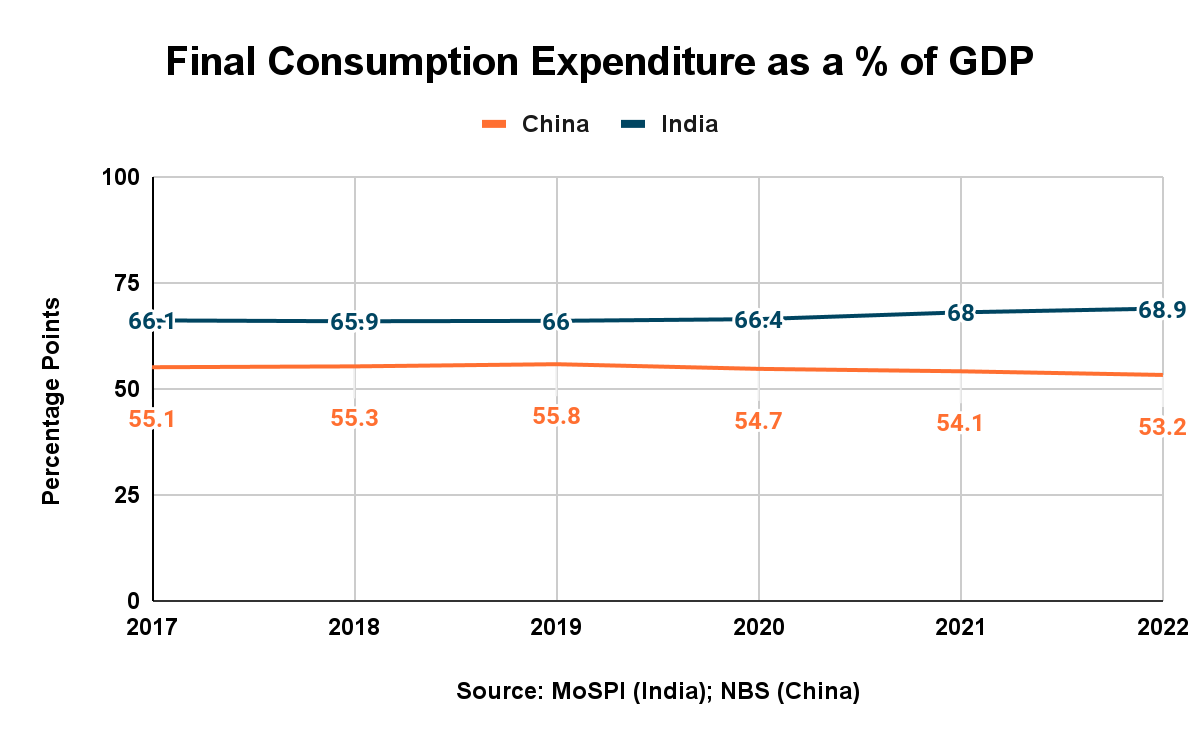
Private Final Consumption Expenditure (PFCE), which measures total consumption expenditure by households and non-profit institutions serving households on goods and services, serves as a useful proxy for consumer spending especially as income and consumption are concentrated within the consumer classes. The data reveals that as a percentage of GDP, India spends significantly more on consumption than China. While PFCE contributes more than 58% to India’s GDP currently, it contributes only 38% to China’s economy. Additionally, the final consumption, which also includes government consumption expenditure, constitutes 68% of the GDP for India and 53% for China. This implies that the government is a much bigger consumer in China than in India. Furthermore, while the percentage for India is steadily increasing, the same for China has been on a decline.
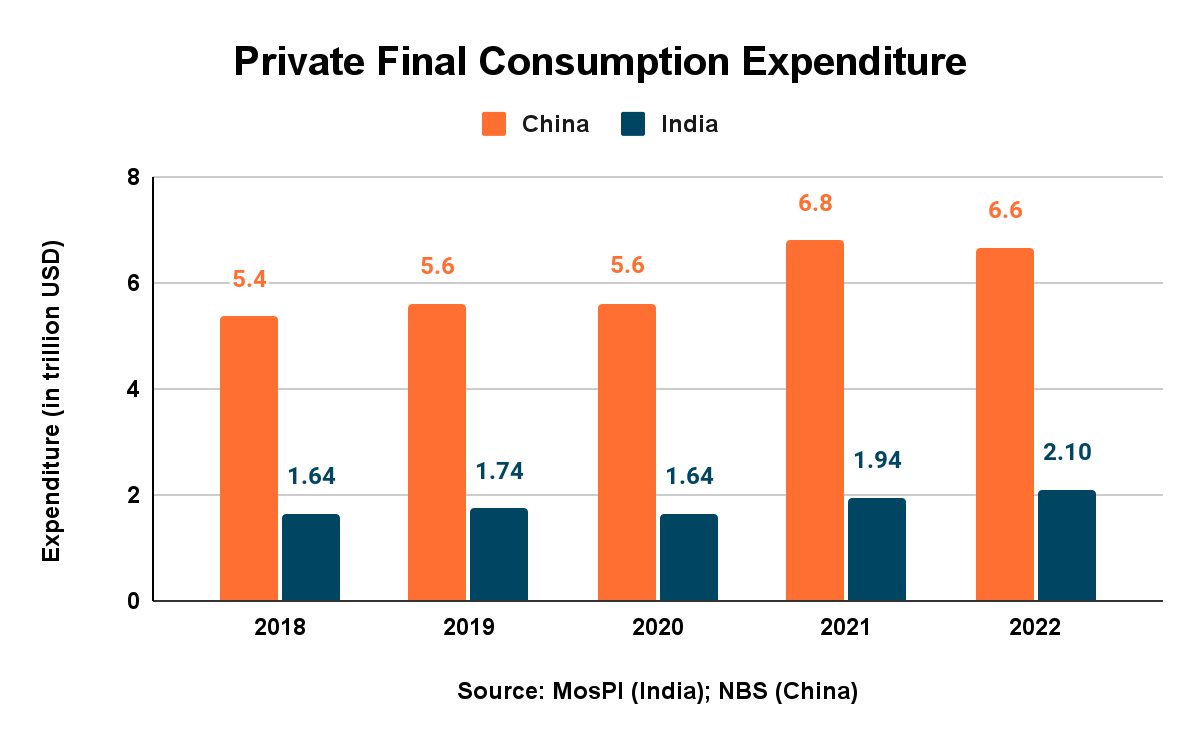

The aggregate data on PFCE reveals that despite China’s economy being approximately five times bigger than that of India’s, its PFCE amounts to relatively a lot less, only about 3.5 times that of India’s. This not only means that consumption is a much larger contributor to India’s GDP, but that India will equal China’s consumption level at a relatively much lower GDP (~$10 trillion) as against China, which achieved the scale at approximately $17 trillion.
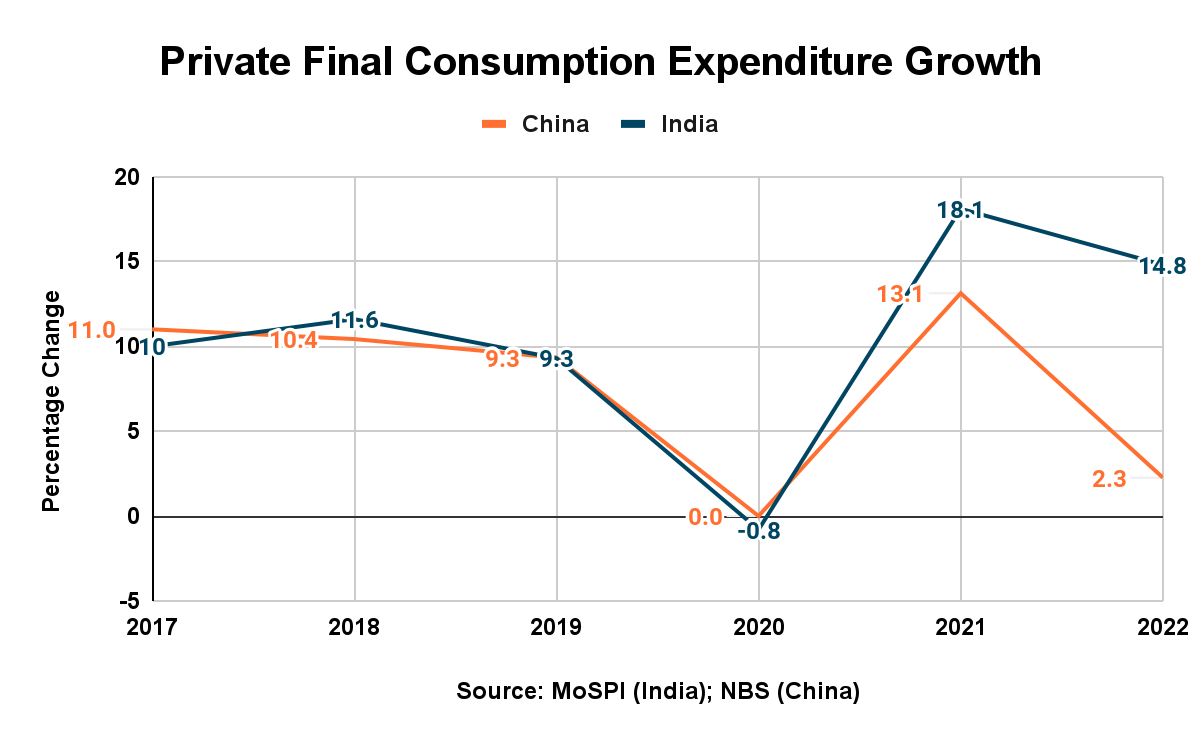
Secondly, despite the gloomy narrative around China’s consumption, its PFCE has registered a significant increase in the past four years. Its PFCE remained rather constant in 2020 (pandemic year) before registering a huge uptick in 2021. On the other hand, India’s figures have steadily increased from $1.64 trillion in 2018 to $2.10 trillion in 2022. Thirdly, in 2022, while China recorded a decline in its numbers — both aggregate ($6.6 trillion compared to $6.8 trillion) and per-capita ($4,730 compared to $4,809) — India witnessed marginal growth in both categories. Nevertheless, the difference in the expenditure between the two countries has widened from $3.8 trillion in 2018 to more than $4.5 trillion in 2022.
Finally, in terms of ratio, India’s PFCE has closed the gap with China from ~3.3 to ~3.1. The significance of India closing the gap in terms of ratio here needs to be underlined. Usually, with a country like China that is operating on a huge base, even a marginal growth rate could inflate the aggregate numbers manifold. This would be true even if India, on the other hand, were adding expenditure at a relatively higher growth rate than China. But to beat China in terms of ratio would have required India to grow at a significantly higher rate than China, which it did.
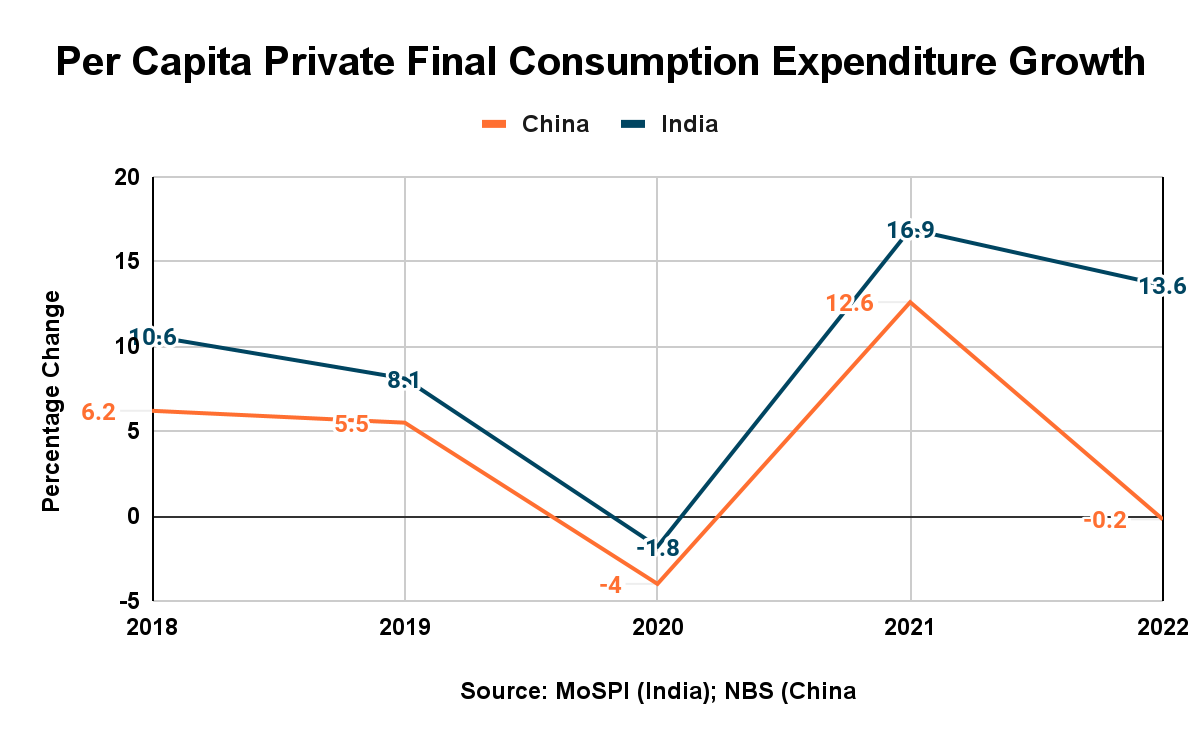
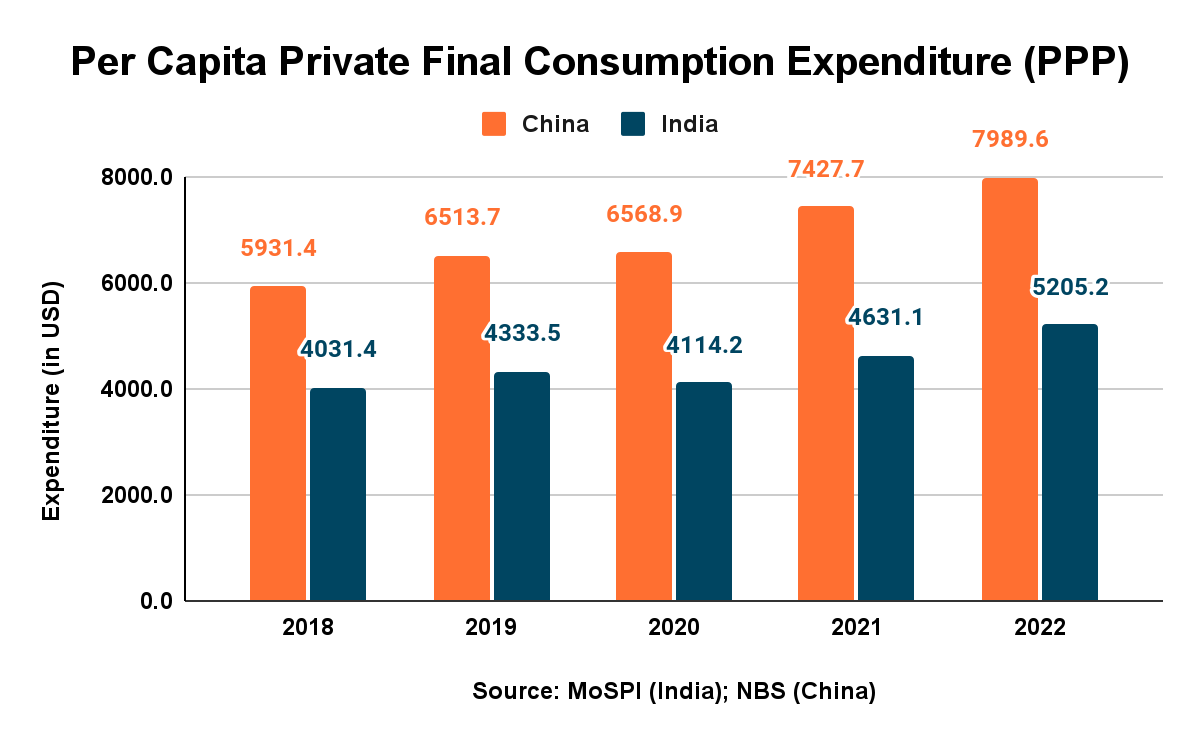
In terms of per capita PFCE, while the values mirror aggregate numbers, there is one exception. Even as India closed the gap in aggregate terms, China widened the per capita PFCE marginally from ~3.0 times of India in 2018 to ~3.1 in 2022. This could be explained by China’s negative population growth in 2022.
Comparing the nominal PFCE numbers alone could sometimes lead to a distortion. This is because the nominal figures do not take into account the discrepancies between the cost of living that might exist. Consumption is not just about consumed value but also consumed volume. And nominal figures only give an idea of total consumption value — might not give an idea of the volume of goods and services consumed. Thus, to account for consumption by value, a comparison of PPP figures becomes imperative.
On comparing the PPP numbers, the gap between the consumption expenditure further closes down. In PPP terms, China’s PFCE is approximately 1.5 times that of India. To put this in context, China’s GDP (PPP) is approximately 2.5 times of India’s. The relative gap between China and India widened from ~1.58 in 2018 to ~1.66 in 2020 and 2021, but 2022 witnessed India closing the gap to ~1.55.
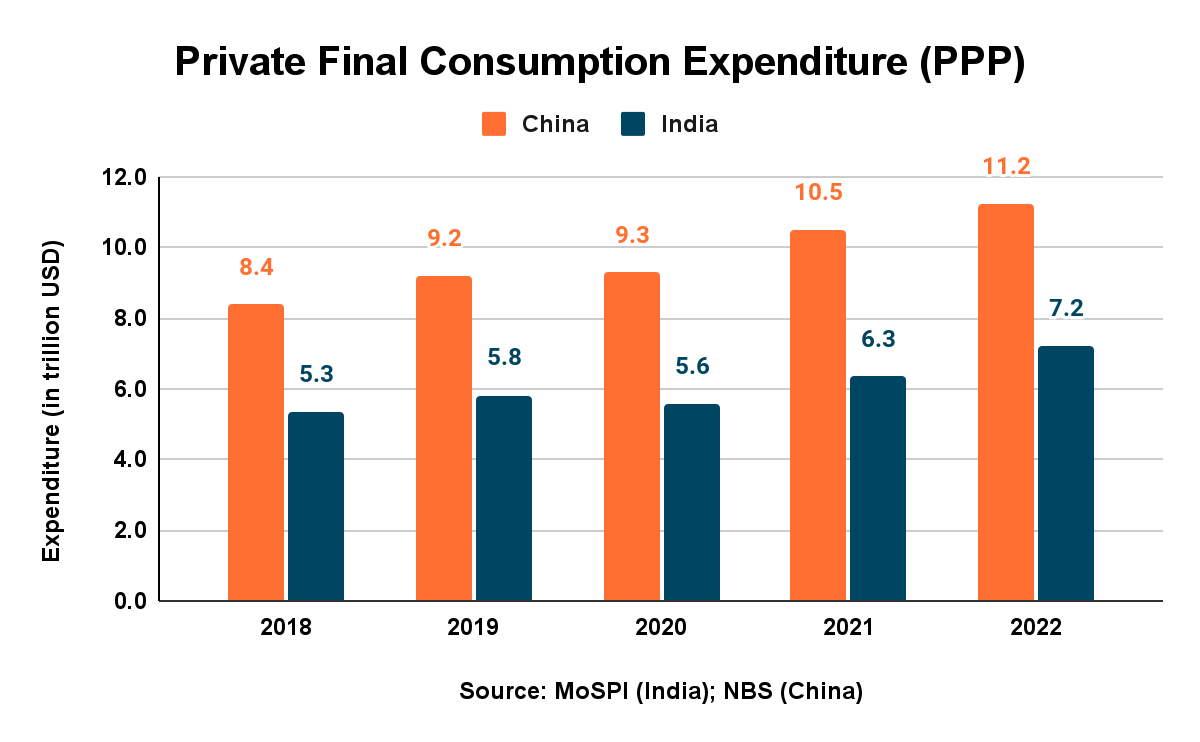
However, in PPP terms, China witnessed a marginal increase of ~$0.7 trillion owing to improved yuan-dollar PPP exchange rates. On the other hand, India added a trillion dollars to its consumption expenditure (PPP) in 2022 despite a worsening exchange rate.
Expenditure by categories
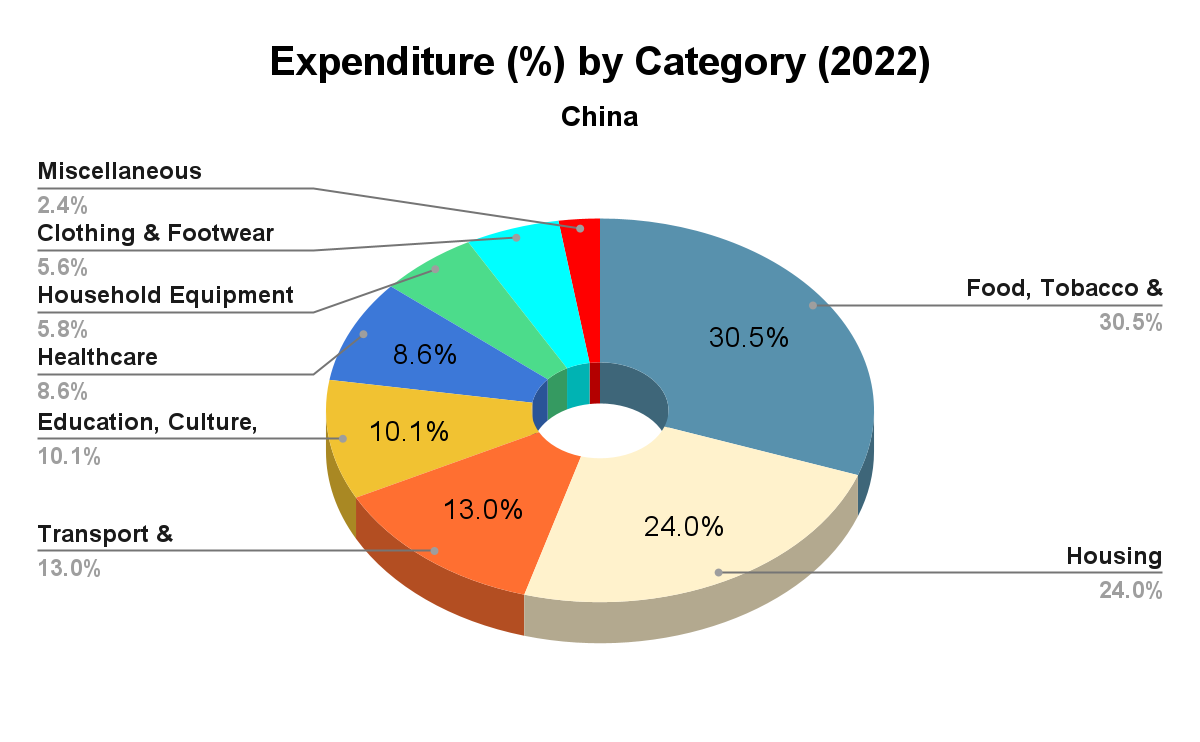
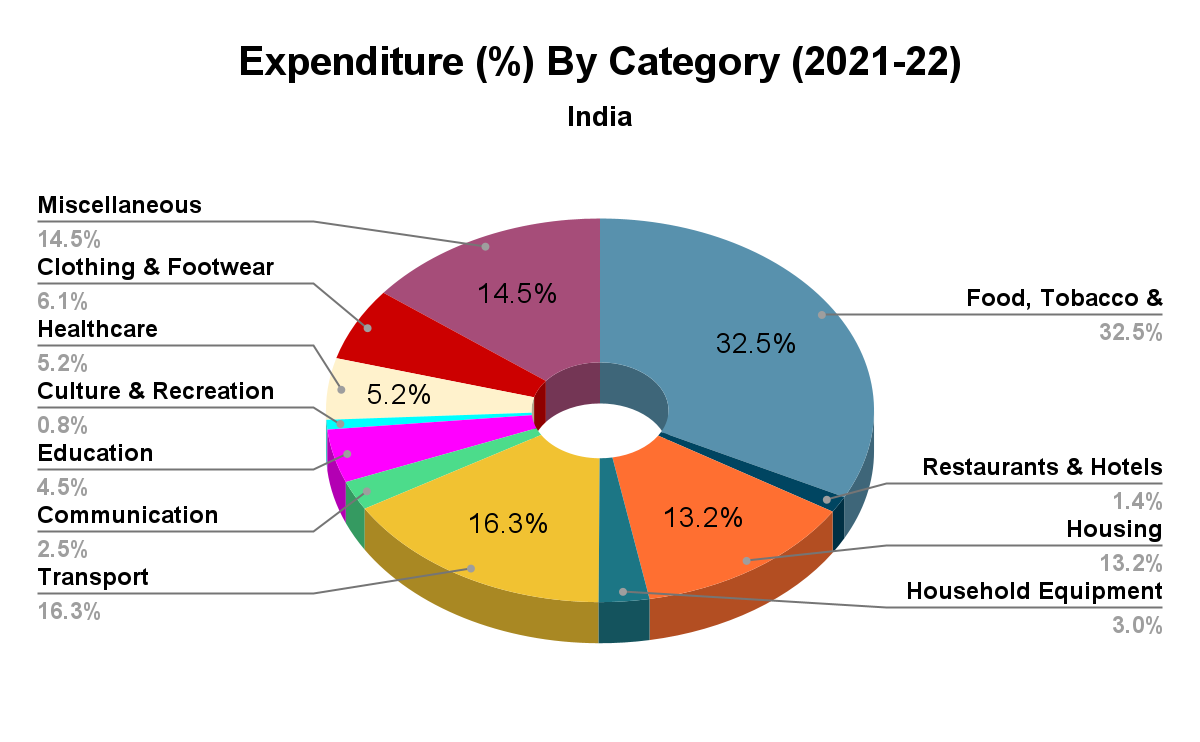
India’s consumption expenditure is characterised by higher spending on food, clothing, footwear, and transport and low spending on education, culture, recreation, and healthcare — typical of an underdeveloped or developing market. China’s consumption basket, on the other hand, represents a relatively developed market. Even as food and beverages constitute the biggest chunk of China’s consumption, it is declining as a percentage of its total consumption expenditure — a sign of a maturing market. Additionally, it spends a substantially higher percentage of its expenditure on housing, white goods, recreation, education, and healthcare than India. To put things in context, in advanced economies like the U.S., Japan, EU, Germany and the U.K., expenditure on food isn’t the highest bracket.
In aggregate terms, India spends around half of what China spends on food, transport and communication, and clothing and footwear. For India, which is a fifth of the Chinese economy and spends almost the same percentage (of the total expenditure) as China on these three sectors, the fact that its total expenditure in the above three categories is around half of China is quite significant. In fact, India spends a little over 50% of what China spends on transport and communication. (Note: India’s data for 2022 were not available.)

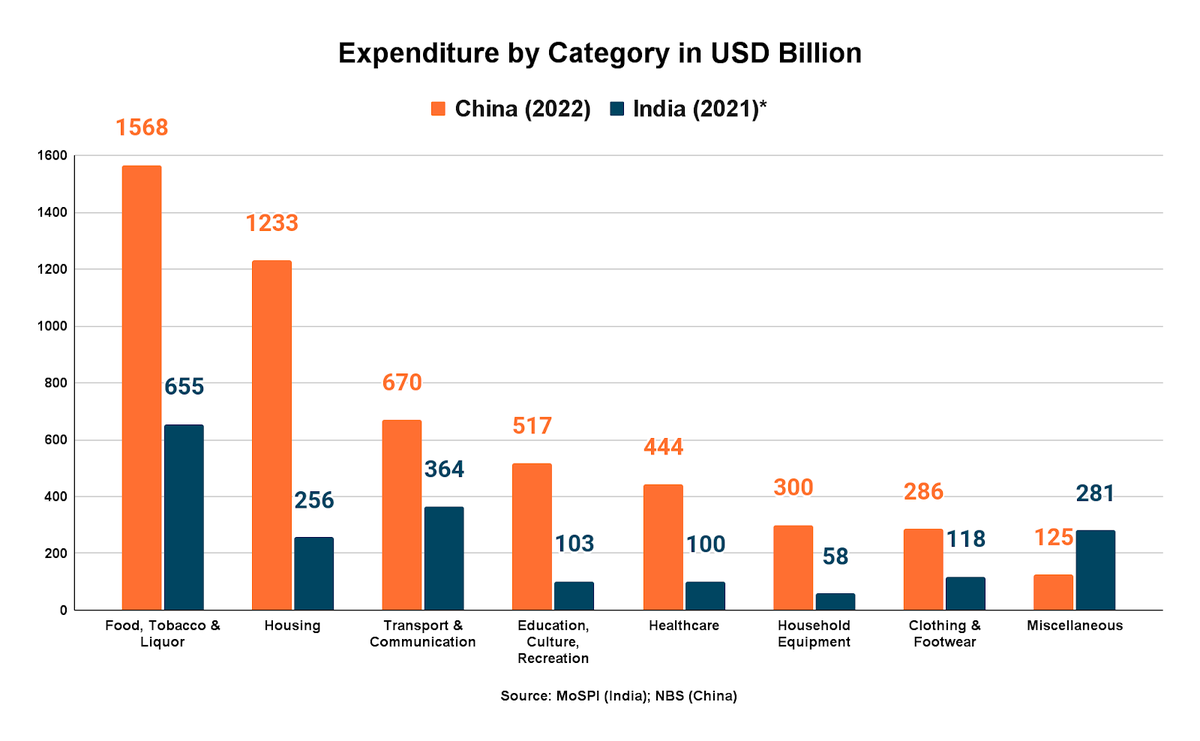
Adding to the optimism is the fact that the real growth rate registered by each of these individual categories in India often outperformed even the nominal growth rates observed in China.
Whether India’s consumer class with increased spending enhances its appeal to foreign businesses as a preferred destination over its competitors amidst the China+1 narrative remains to be seen.
Amit Kumar is a Research Analyst at Takshashila Institution. He tweets at am_i_t_kumar.